


Competence Curve’s Case Studies
High Performance Team increases customer satisfaction from 71 % to a consistent level of 100 %
Results-Focused Coaching Creates Financial Savings of $197,610
Diverse Approach Impacts employee handling capacity by 800 hrs
Improved performance in the company with significant reduction in Average Handling Time
Improvement in Customer Satisfaction from 69 % to 78 %
Diverse Approach Impacts Employee Satisfaction with improvement in annualised attrition from 76 % to 61 % and drop in Absenteeism by 8 % in 4 months
Results-Focused Coaching Improves Efficiency by 42 %
Diverse Approach Impacts Employee Satisfaction with 32% increase in approved leaves & 11% reduction in sick leaves
Creating an Effective Hire Training Process with exceeding the training threshold of 70% by 76% in a process and 90% in another process
Enhancing Customer Service Delivery with increase in total problem resolution from 66% to 70%
Assessment based coaching brings overall average growth of 85 % in the competency – Customer orientation
Building on development center results to growth of 119 % in the competency – Achievement orientation
3 level intervention results to 130 % hike in average growth of competency – Driving change
Coaching intervention gets 133 % growth in the competency – planning & execution
Training and coaching intervention in a GMP program leads to over 70% improvement in all competencies for over 100 participants
Competencies we have built:
Competence Curve has worked with the clients to facilitate remarkable & measurable improvements around following competencies
| Category | Highest growth by the Batch |
|---|---|
| Building Leaders | 76% |
| Commitment for excellence | 94% |
| Driving change | 130% |
| Effective Communication | 104% |
| Planning & Execution | 133% |
| Strategic Perspective | 83% |
| Customer Orientation | 142% |
| Working in teams | 122% |

CASE STUDY 1: BIG 4 CONSULTING FIRM
PROBLEM STATEMENT
Lots of missed opportunity in the market due to functional experts were not focussed on new opportunity.Backend conversation with other service lines was not happening.
SOLUTION DESIGNED
Competence Curve crafted an OD Intervention to build a Culture of Entrepreneurship & Collaboration.Behaviours for the above two elements were defined and frozen.
The Behaviours for Entrepreneurship & Collaboration were introduced to various client facing population.
Leaders were trained on encouraging & reinforcing the key behaviours of Entrepreneurship & Collaboration.
RESULTS
Number of business enquiries went up due to surge in Entrepreneurial behaviours was demonstrated.Number of closures went up due to Collaboration efforts backend.
METRICS IMPACTED
Number of EnquiriesNumber of Closures
CASE STUDY 2: GLOBAL RETAIL CLIENT
PROBLEM STATEMENT
The organisation was growing fast in India and expanding its network. There was a need felt to build more Culture of Collaboration, Ownership & Service.SOLUTION DESIGNED
Behaviours were designed for various levels of management.Rules of engagement were finalised with various Senior Management Stakeholders.
Roll out happened from Sr. Management of India Team.
45 VP’s started to live as role models and eventually cascaded the behaviours.
Principles of Applied Behaviour Science were deployed using Rituals, Nudges and Conversations to create a positive impact.
Roll out was done for retail store impacting Sales & NPS.
RESULTS
Average sales at Pilot Stores went up.NPS scores saw a positive impact.
Collaborative cultural indications saw a positive impact.
METRICS IMPACTED
SalesNPS
Culture Scores
CASE STUDY 3: GLOBAL HEALTHCARE CLIENT
PROBLEM STATEMENT
Work Flow between functions was slowing down & the organisation felt that this is leading to non achievement of AOP.SOLUTION DESIGNED
Organisational values were well defined with the behavioural indications.They were cascaded across the organisation using LSIP as an approach.
Top Management went through sessions on Power of 1 to become more cohesive & productive.
Organisational Capability Building was done using Managers as a Coach concept.
It was followed through using Principles of Applied Behaviour Science of Antecedent Behaviour Consequence.
RESULTS
The organisation saw more ownership and cohesiveness at the top.There was higher alignment to common goals.
organisational Capability become stronger.
Culture of Collaboration & ownership was embedded in the DNA of the organisation.
METRICS IMPACTED
AOP metrics saw a positive movement.CASE STUDY 4: OIL & GAS CLIENT
PROBLEM STATEMENT
Since the organisation was going through major transitions, they wanted to make their leader effective in managing change and achieve their audacious business goals.SOLUTION DESIGNED
A 360 was conducted around the Competency Framework & awareness was built in about 100 leaders.An entire leadership journey was curated to impact the learning that would lead to higher effectiveness.
The journey was implemented using over 12 leadership development tools.
Post 360 degree showed 40% + improvement with all the participants.
RESULTS
The client saw a stronger leadership pool within the organisation.Most leaders came across as future ready for higher Roles.
AWARDS
Client CII Award for best practice in Leadership Development.CASE STUDY 5: GLOBAL TECHNOLOGY CLIENT
PROBLEM STATEMENT
The client wanted to develop a100 + Seniors but was looking to measure the business impact of the Journey.SOLUTION DESIGNED
A DC was conducted for all 100 + leaders.Pillars of excellence around Business Acumen, Entrepreneurial Thinking, Leading Others & Customer Centricity were designed.
A clear focus was on Measures of Success in alignment with the KRA’s.
Organisational Capability Building was done using Managers as a Coach concept.
Over 10 Leadership Development tools were deployed.
A 12 month learning journey was executed with some of the finest educators & coaches in India.
RESULTS
100% leaders showed a positive growth around Measures of Success.Internal promotions surged from this pool of leaders.
All business Metrics improved.
METRICS IMPACTED
NPS over 10%.NPS over 10%.
Revenue impact of over $100M.
Gross impact of over $10M.
Internal promotions of over 70% from this pool.
AWARDS
Developing leaders of Future by SHRM.
Case Study 6: High Performance Team increases customer satisfaction from 71% to consistent level of 100%
PROBLEM STATEMENT
The client had some employees in Resbay (Resolution Bay). Resbay comprised of a 4 week training program where in team member were kept under the employee conservation plan. Resbay was an outlier management program where in Customer Satisfaction was driven by driving Resolution. Resbay had an internal target of 80% graduation. There was no direct control over the team. There was demotivation in the agents due to non performance and employee conservation plan. The team changed every 4 weeks as the old members were frequently replaced with new agents.SOLUTION DESIGNED
Competence Curve supported the team in implementing the leadership behaviours, focussing primarily towards the big picture of the future prospects amongst the employees. The managers were coached on specific skills to challenge the existing process and bring improvement. Eventually, the teams were supported in the decision making towards the achievement of the internal target.RESULTS
Competence Curve helped the client by sustaining high customer satisfaction and also improving it.Competence Curve helped the client reach the following results:
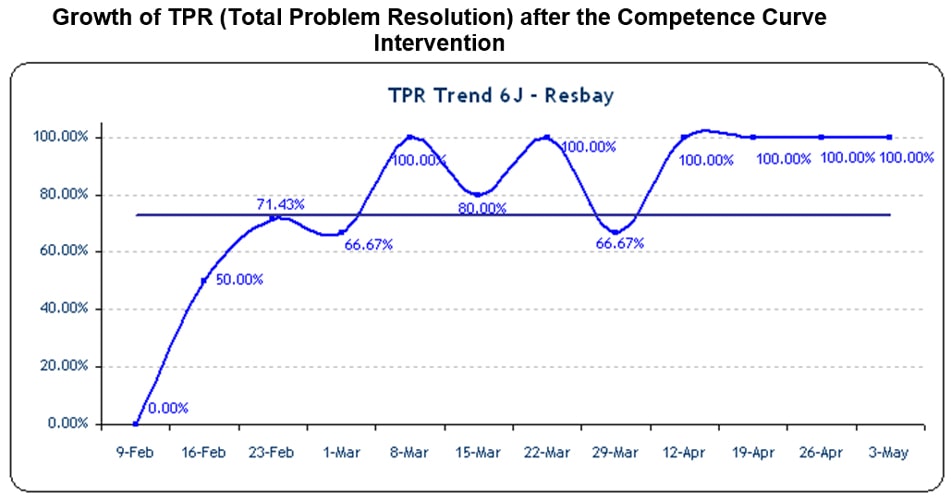
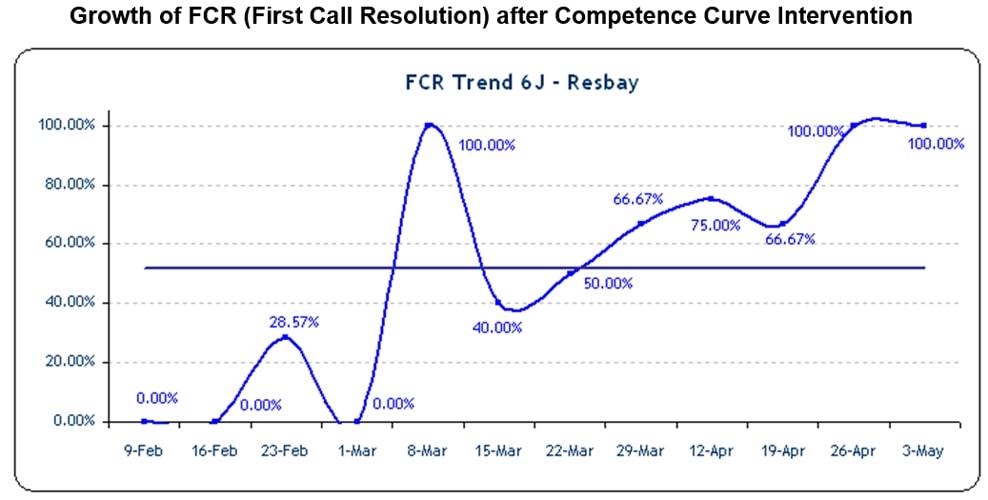
Total Problem Resolution (TPR) is the resolution index which is calculated on the basis of total number of surveys where in customer rates that his issue is resolved to the total number of Surveys received. Similarly, FCR (First call resolution) is calculated if the issue was resolved in first contact.
TPR (Total Problem Resolution) in Resbay moved from 71 % up to 100 % and was finally consistent at 100 %.
FCR (First call resolution) in Resbay also achieved 100 % consistency level.
Case Study 7: Results-Focused Coaching Creates Financial Savings of $197,610
PROBLEM STATEMENT
A client targeted "increased efficiency and effectiveness”. The earlier focus was on process improvement, cost control, and efficiency programs but had never targeted leadership effectiveness as a major success driver. Thus, there were no concrete results.SOLUTION DESIGNED
Competence Curve provided leadership development and coaching to all the managers. The coaching focused on creating high-performance leadership behaviours and bottom-line business results. These individuals learned to set clear expectations, hold people accountable for their commitments, and provide frequent positive and constructive feedback. They were assisted in defining their philosophy of leadership and developing a challenge taking and risk-taking approach to bring improvements in the existing processes. They were trained in the area of rewarding and team building.RESULTS
Competence Curve helped the client by sustaining high customer satisfaction and also improving it.Competence Curve helped the client reach the following results:
Competence Curve helped in reducing costs and improve the leadership effectiveness of its leadership team. Samples of project improvements include:
Roster Adherence System was introduced for the first time.
There were savings of $197,610 in Quarter 1. This was the highest savings done amongst other accounts in the company across all locations
Case Study 8: Diverse Approach Impacts employee handling capacity by 800 hrs
PROBLEM STATEMENT
A client had issues of low morale amongst employees.SOLUTION DESIGNED
Competence Curve provided follow-on training and guidance to the leadership team regarding leadership skills. The leadership team introduced behaviour-based solutions.Through Competence Curve’s support, managers learned to activate and sustain desired Leadership Behaviours for team members. Coaching improved the competence and confidence of managers as leaders and agents of positive behaviour change, leading to improved morale for the team members. The participants were provided coaching around the areas of common values adherence, art of appreciation and rewarding and future orientation & planning.
RESULTS
Competence Curve helped this company improve its overall performance by focusing on the Leadership Behaviours of employees, managers, and senior leaders.Competence Curve helped to achieve the following results:
There was an increase in the handling capacity by 800 hours in the month of Jan & Feb as the overtime incentive was introduced was the first time.
Sick leave policy was introduced for the first time.
There was an increase in People Engagement Activities.
To understand issues and concerns of the agents, pre-planned daily one-one sessions were made mandatory. These sessions focused significant issues like appreciations for job well done & showing them the way ahead.
An increase in touch time with the agents was observed. Their issues & concerns were taken into consideration and resolved.
There was Zero Supervisor level attrition amongst direct reports in the last one year.
There was vertical growth of people within the span in the last 2 quarters with promotions of following:
o 1 Manager
o 3 Sr. Group leaders
o 1 Group Leader
o 8 Quality Analysts
Case Study 9: Improved performance in the company with significant reduction in Average Handling Time
PROBLEM STATEMENT
The leadership team of a client had issues regarding improvement in overall performance.SOLUTION DESIGNED
Competence Curve provided training & coaching around the Leadership Behaviours to the leadership team. The leadership team introduced behaviour-based solutions. The participants were given coaching around goals setting, risk-taking capacities and establishing the flow to bring improvement in the current processes.Competence Curve supported the managers to improve on the competencies and confidence as leaders. Eventually, there was a positive behaviour change, leading to improved overall performance.
RESULTS
Competence Curve helped to achieve the following results: There was a significant increase in the Level 1 & Level 2 Tech queues handling. As compared to Q3, the Tech queues increased by 13% & 12% respectively in Q4
A consistent performance in the CSAT (Customer Satisfaction) Standardization was initiated in Q4. There were significant gains seen in Agent Variation Management
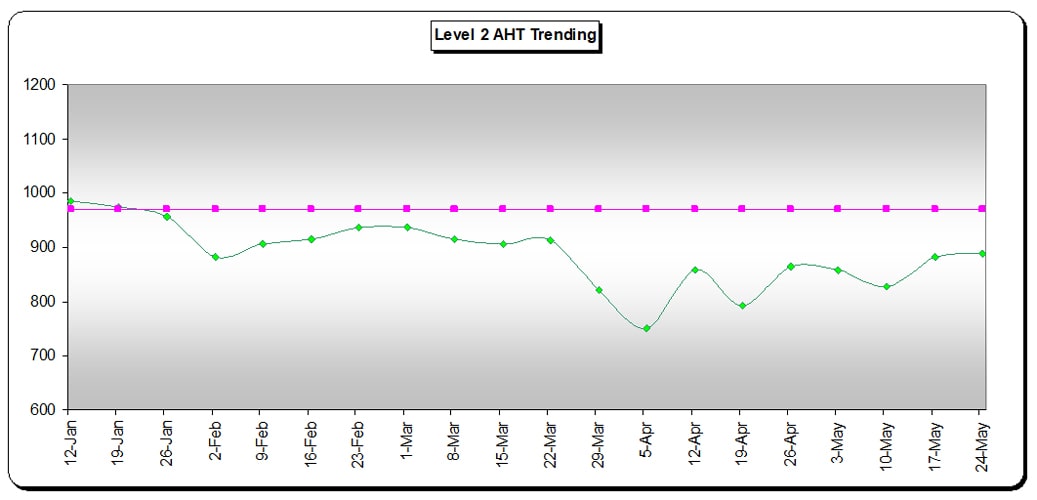
Project Revamp was successfully rolled out in the process which resulted in reduction of the AHT (Average Handing Time) & increase in handling of the calls.
NMQ (Network Migration Queue) was successfully launched with hiring and training of 57 FTEs. A training module was developed & technology was set up with a turnaround time of less than two weeks.
Several contests, such as Quarter AHT (Average Handing Time) contest, were successfully rolled out in the process. These contests focused at rewarding high performing employees. This resulted to a remarkable impact on Representative satisfaction & AHT (Average Handing Time)
The downtime policy for the floor was revisited.
There was a significant increase in the billable AHT (Average Handing Time).
Reduction in AHT as a result of Competence Curve Intervention
Case Study 10: Improvement in Customer Satisfaction from 69% to 78%
PROBLEM STATEMENT
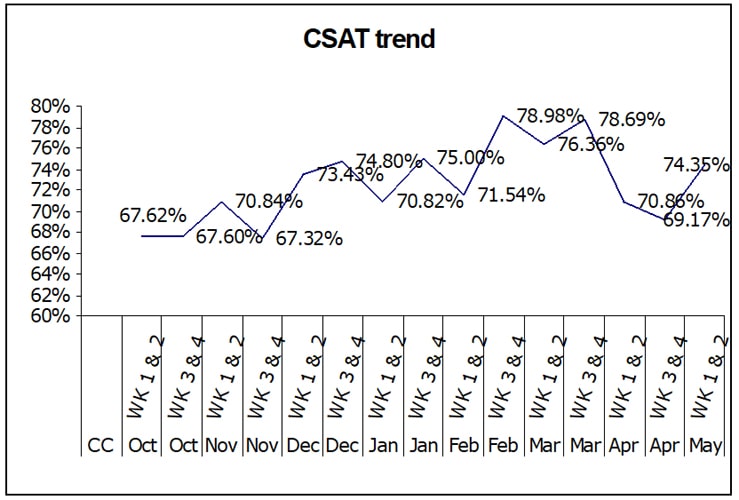
A Fortune 100 client had an outstanding reputation for offering customized service. However, the challenge was to ensure the consistency in C-SAT Trends. Instead of a technological solution, Competence Curve coached the client to turn towards a people performance solution.SOLUTION DESIGNED
Competence Curve supported the team in mapping the vision, mission, and objectives. Our implementation road mapping process guided leaders in planning the Behaviour Skill Set they would deploy to achieve the set target. The roadmap also helped relook at roles of leaders and select initiatives on which to focus.Competence Curve also provided leadership development—360° assessments, training, and 1:1 coaching.
RESULTS
Competence Curve helped the client not only sustain high customer satisfaction, but improve it.CSAT improved for the group from 69% to 75% to 78% in Feb and March.
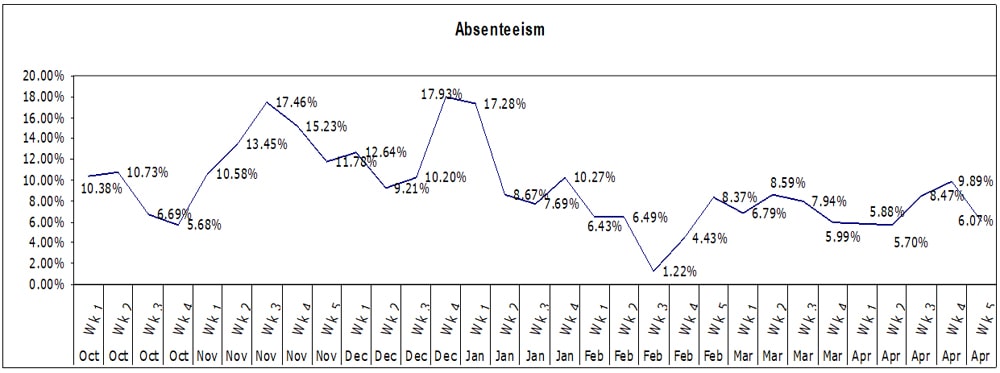
Case Study 11: Competence Curve Diverse Approach Impacts Employee Satisfaction with improvement in annualised attrition from 76 % to 61 % and drop in Absenteeism by 8 % in 4 months
PROBLEM STATEMENT
The team sought help in improving employee morale. The company had identified gaps in employee satisfaction basis the 360-degree assessments run by Competence Curve. This was also evident in the high absenteeism and attrition%SOLUTION DESIGNED
Competence Curve conducted training and provided guidance to the leadership team regarding supervisory, coaching, and leadership skills. The senior leadership team introduced behaviour-based solutions throughout the organisation.Through Competence Curve support, leaders learned to deploy Leadership Practices which helped in activating and sustaining desired Behaviours in the Employees. Coaching improved the competence and confidence of supervisors as coaches. Positive behaviour change in the team, when supplemented with positive and proper reinforcement saw a reduction in performance gaps and improved morale for the entire organisation. This ultimately witnessed containment in attrition and absenteeism.
RESULTS
Competence Curve helped this company improve its overall E-SAT by coaching and help implementing the employees and managers certain Leadership Practices.
Improvement on Annualized attrition within the group from 76% in Dec to 61% in April.
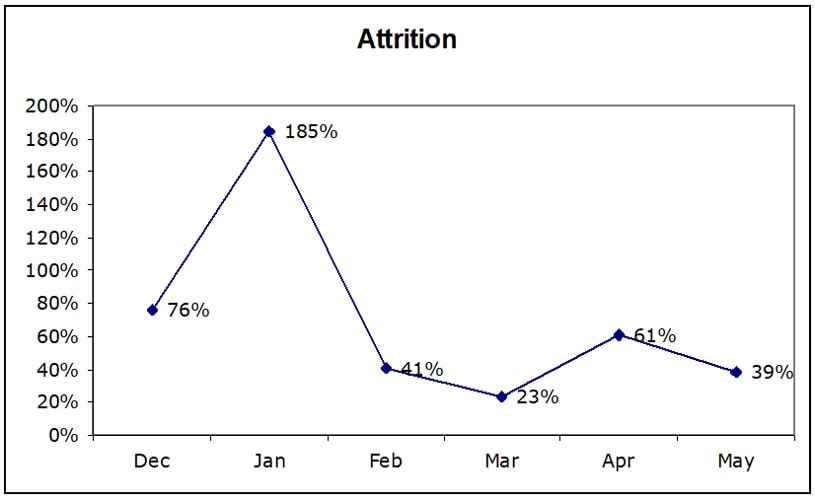
Absenteeism for the group was at 15% from October till December which has improved to less than 7% for 13 weeks in a row
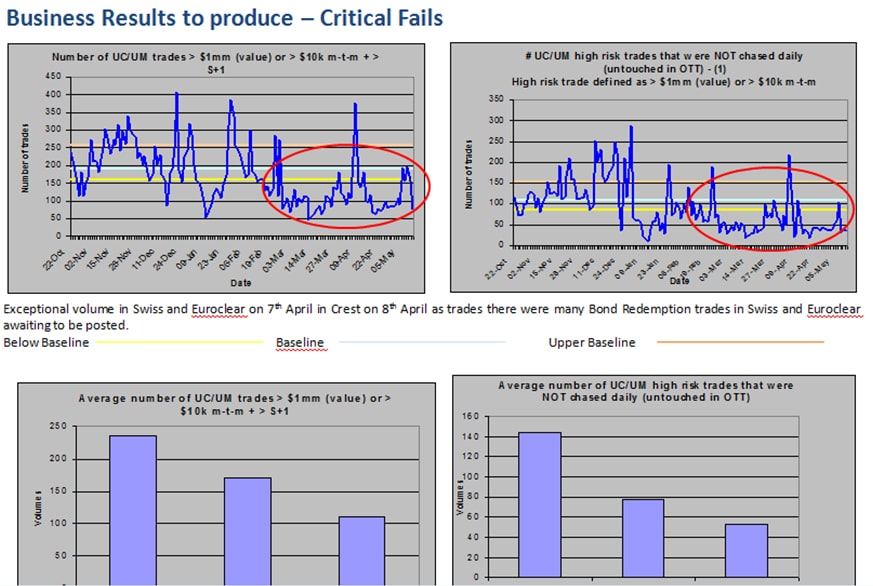
Case Study 12: Results-Focused Coaching Improves Efficiency by 42%
PROBLEM STATEMENT
A company targeted at bringing down the average number of UC (uncheck)/UM (unmanaged) trades (financial transactions) of cash value > $1mm and > $10k month-to-month. The number of such trades was 236.SOLUTION DESIGNED
Competence Curve provided leadership development and coaching to the leaders. The coaching focused on creating high-performance leadership behaviours to improve bottom-line business results. These individuals learned to set clear expectations, hold people accountable for their commitments, and provide frequent positive and constructive feedback.RESULTS
Competence Curve helped the client reduce costs and improve the leadership effectiveness of its leadership team.a) All critical fails to be investigated and updated
The team was successful in getting down to an average of 111 trades
The performance of the team became 30% higher than the lower baseline target and 42% better than the baseline target.
Basis, the leadership coaching, the leaders focused on people and their alignment to the organisation. The team members were quickly initiated to the organisational goals and were now able to see a direct linkage between their goals and the BIG picture.
RESULTS
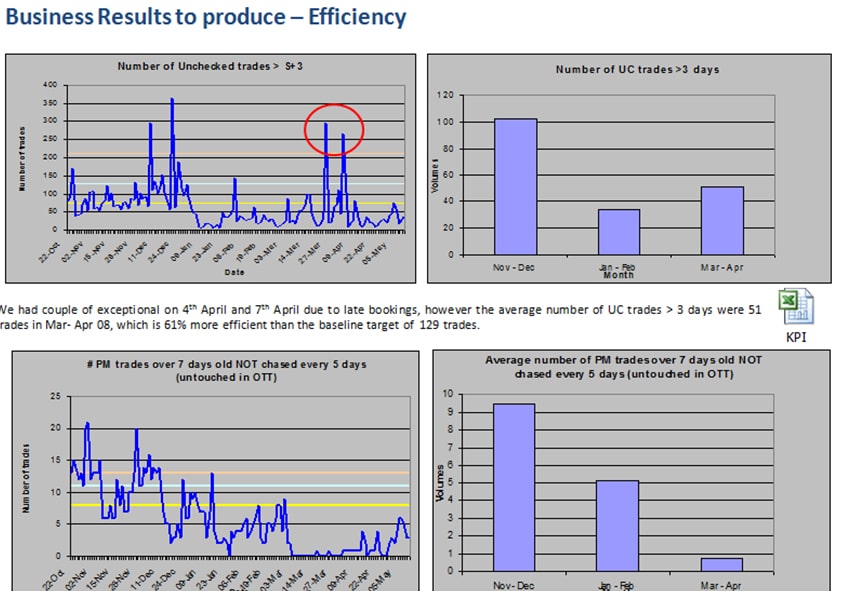
The average number of UC (uncheck)/UM (unmanaged) high risk trades (> $1mm (cash value) or > $10k m-t-m) that were NOT chased daily (untouched in OTT) was 53 trades as compared to 77 trades and 144 tradesThe performance of the team has increased by 39% on the lower baseline target and 51% on the baseline target.
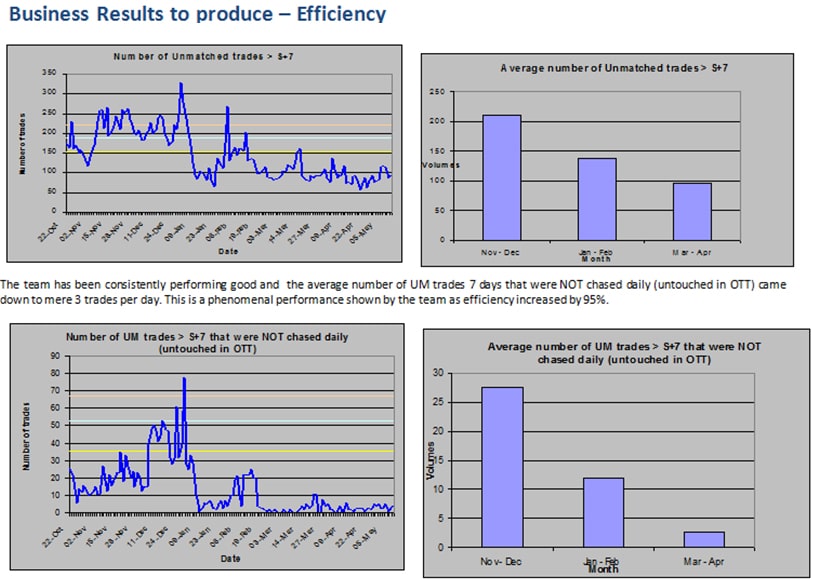
b) Increase in efficiency of settlements team
RESULTS
Average number of UM (unmanaged) trades > 7 days old reduced to an average of 95 trades per day, an improvement of 55% as compared to stats and 31% against other stats. Overall, the performance increased by 50% to the baseline numbersAverage number of UM (unmanaged) trades 7 days that were NOT chased daily (untouched in OTT) came down to mere 3 trades per day. This is a phenomenal performance shown by the team as efficiency increased by 95%. The average was 28 and 12 trades.
Average number of UC (uncheck)> 3 days were 51 trades, which is 61% more efficient than the baseline targets
Average number of PM trades over 7 days old NOT chased every 5 days (untouched in OTT) reduced to only 1 trade per day, which is 93% more efficient than the baseline targets.
Case Study 13: Assessment based coaching brings overall average growth of 85% in the competency–customer orientation.
PROBLEM STATEMENT
The client approached Competence Curve to improve the leadership competencies to get the desired business growthSOLUTION DESIGNED
Competence Curve team conducted a pre-assessment on the competencies of the participants from the client side. Based on the pre-assessment, a coaching module was developed and deployed. Under the coaching process, participants were assisted on practicing the critical behaviours like – setting the feedback mechanism, building consensus around the common values, Sharing the future trends, envisioning the future, seeking challenging opportunities, risk raking, supporting and appreciating, Team building etc. Competence Curve team also conducted a post assessment to analyse the growth in the competencies after the intervention.RESULTS
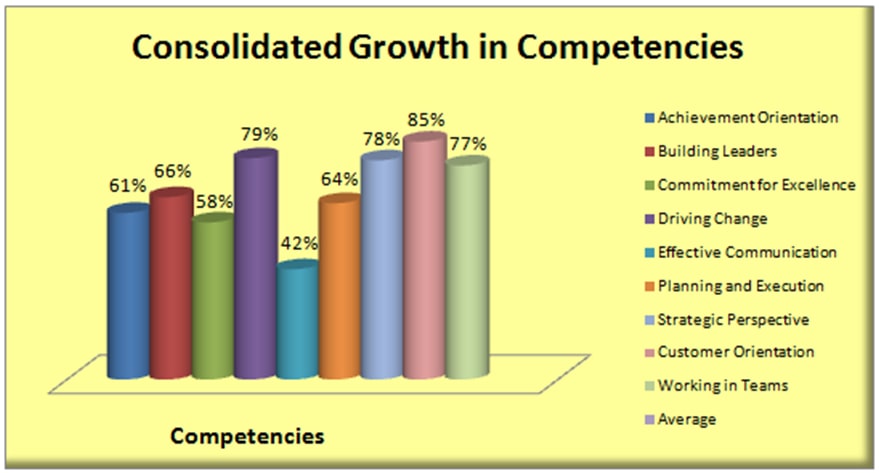
Competence Curve helped the client to achieve the following results:Consolidated Achievements:
The average growth of 79 % was achieved in the competency – Driving ChangeThe average growth of 78 % was achieved in the competency – Strategic Perspective
The average growth of 77 % was achieved in the competency – Working in teams
The average growth of 66 % was achieved in the competency – Building Leaders
The average growth of 64 % was achieved in the competency – Planning and Execution
The average growth of 61 % was achieved in the competency – Achievement Orientation
The average growth of 58 % was achieved in the competency - Commitment for Excellence
The average growth of 42 % was achieved in the competency - Effective Communication
Individual Achievements:
188 % growth of a participant in the competency – Building Leaders167 % growth of a participant in the competency – Driving Change
122 % growth of a participant in the competency – Planning and Execution
76 % growth of a participant in the competency – Effective Communication
Outstanding Achievements:
The highest record of the overall average growth of 85 % was achieved in the competency – Customer orientation.Highest growth of 300 % was achieved by a participant in the competency – Working in Teams.
Highest growth of 233 % was achieved by a participant in the competency – Achievement Orientation.
Highest growth of 227 % was achieved by a participant in the competency – Commitment for Excellence.
Highest growth of 208 % was achieved by a participant in the competency – Strategic Perspective.
Highest growth of 208 % was achieved by a participant in the competency – Customer Orientation.
Case Study 14: Building on development center results to growth of 119% in the competency – achievement orientation.
PROBLEM STATEMENT
A client had requirements of competency development to facilitate effective leadership in the organisation.SOLUTION DESIGNED
The clients had conducted a Development Center. Competence Curve team analysed the Development Center Scores (DC Scores) and designed an intervention program accordingly. The team selected appropriate behaviours that impact the development of the competencies. Feedback was taken from the Direct Reportees and the Supervisors of the participants to get a 360 % approach. Coaching was provided on the basis of the results of the assessments and eventually the growth on competencies was facilitated.RESULTS
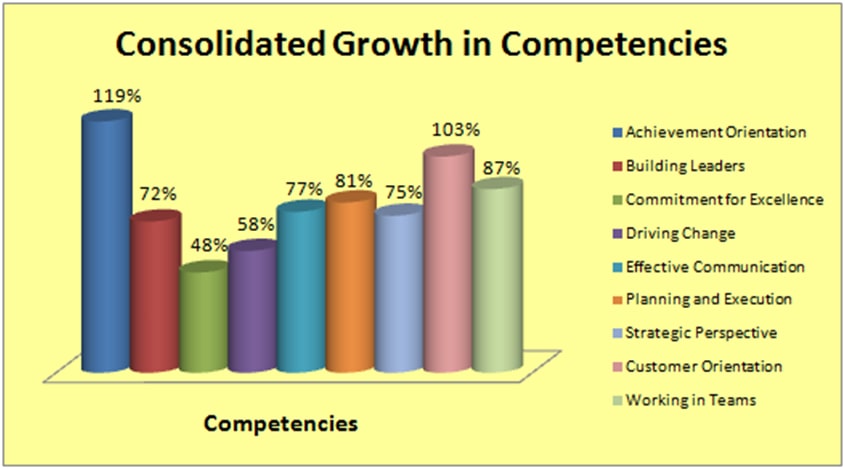
Competence Curve helped the client to achieve the following results:Consolidated Achievements:
The average growth of 103 % was achieved in the competency – Customer OrientationThe average growth of 87 % was achieved in the competency – Working in teams
The average growth of 81 % was achieved in the competency – Planning and Execution
The average growth of 77 % was achieved in the competency – Effective Communication
The average growth of 75 % was achieved in the competency – Strategic Perspective
The average growth of 72 % was achieved in the competency – Building Leaders
The average growth of 58 % was achieved in the competency – Driving Change
The average growth of 48 % was achieved in the competency – Commitment for Excellence
Individual Achievements:
233 % growth of a participant in the competency – Effective Communication200 % growth of a participant in the competency – Driving Change
141 % growth of a participant in the competency – Working in teams
126 % growth of a participant in the competency – Commitment for Excellence
Outstanding Achievements:
The highest record of the overall average growth of 119% was achieved in the competency – Achievement OrientationHighest growth of 300 % was achieved by a participant in the competency – Achievement Orientation
Highest growth of 300 % was achieved by a participant in the competency – Planning and Execution
Highest growth of 284 % was achieved by a participant in the competency – Customer Orientation
Highest growth of 272 % was achieved by a participant in the competency – Building Leaders
Highest growth of 254 % was achieved by a participant in the competency – Strategic Perspective
Case Study 15: Level Intervention Results To 130 % Hike in Average Growth of Competency – Driving Change
PROBLEM STATEMENT
Competence Curve was approached by a client to provide support for the development of leadership competencies to get the desired business growth.SOLUTION DESIGNED
Competence Curve constructed a 3-level leadership development solution for the client. Level I of the intervention comprised of coaching around the practice of critical leadership behaviours. This level ensured that the participants develop the behaviours in a consistent manner. Level II ensured the right practice of the behaviours and attaining a comfort level on each of them in simple situations. Level III of the intervention focussed on practice of the behaviours in complex situations. The 3-level approach proved effective.RESULTS
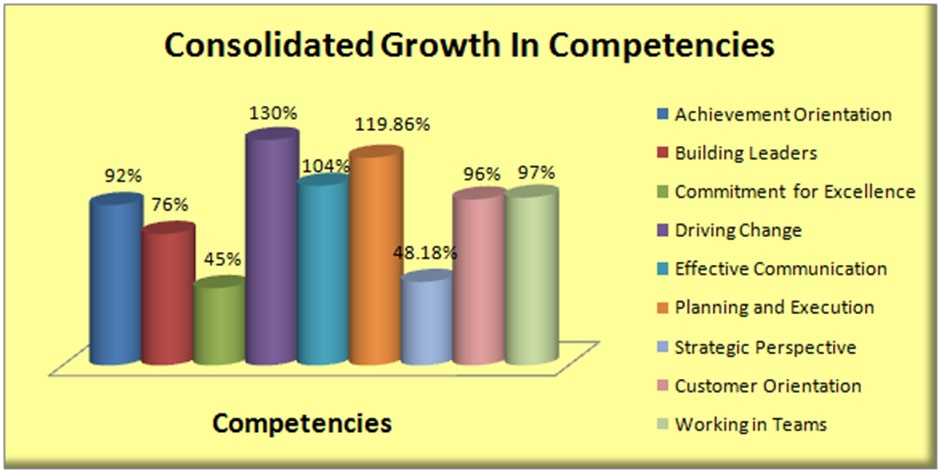
Competence Curve helped the client to achieve the following results:Consolidated Achievements:
The average growth of 119 % was achieved in the competency – Planning and ExecutionThe average growth of 104 % was achieved in the competency – Effective Communication
The average growth of 97 % was achieved in the competency – Working in teams
The average growth of 96 % was achieved in the competency – Customer Orientation
The average growth of 92 % was achieved in the competency – Achievement Orientation
The average growth of 76 % was achieved in the competency – Building Leaders
The average growth of 48 % was achieved in the competency – Strategic Perspective
The average growth of 45 % was achieved in the competency – Commitment for Excellence
Individual Achievements:
200% growth of a participant in the competency – Working in teams133% growth of a participant in the competency – Building Leaders
100 % growth of a participant in the competency – Strategic Perspective
84 % growth of a participant in the competency – Commitment for Excellence
Outstanding Achievements:
The highest record of the overall average growth of 130 % was achieved in the competency – Driving Change.Highest growth of 400 % was achieved by a participant in the competency – Planning and Execution.
Highest growth of 300 % was achieved by two participants in the competency – Driving change.
Highest growth of 300 % was achieved by a participant in the competency – Achievement Orientation.
Highest growth of 245 % was achieved by a participant in the competency – Customer Orientation.
Highest growth of 227 % was achieved by a participant in the competency – Effective Communication.
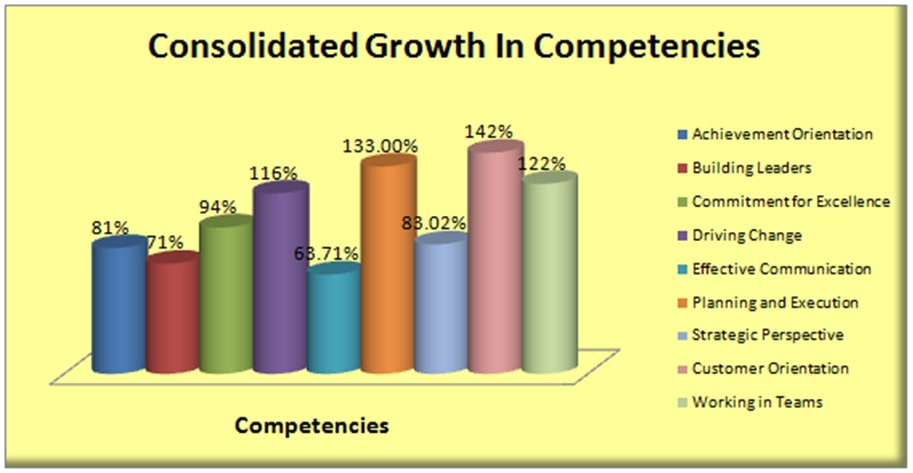
Case Study 16: Coaching intervention gets 133 % growth in the competency – planning & execution.
PROBLEM STATEMENT
The client had defined few competencies to get the desired business growth.SOLUTION DESIGNED
Competence Curve team conducted a pre-assessment on the competencies of the participants from the client side. Based on the pre-assessment, a coaching module was developed and implemented. The participants received training and coaching from Competence Curve trainers around the development of competencies. This extensive intervention was based on 360° fundamental. Development on the competencies was measured on weekly basis for 13 consecutive weeks. This performance was analysed and basis that one-on-one customised coaching was provided by Competence Curve coaches. Realtime coaching proved effective in development of the competencies.RESULTS
Competence Curve helped the client to achieve the following results:Consolidated Achievements:
The average growth of 133 % was achieved in the competency – Planning and ExecutionThe average growth of 122 % was achieved in the competency – Working in teams
The average growth of 116 % was achieved in the competency – Driving Change
The average growth of 94 % was achieved in the competency – Commitment for Excellence
The average growth of 83 % was achieved in the competency – Strategic Perspective
The average growth of 81 % was achieved in the competency – Achievement Orientation
The average growth of 71 % was achieved in the competency – Building Leaders
The average growth of 63 % was achieved in the competency – Effective Communication
Individual Achievements:
333% growth of a participant in the competency – Working in teams233% growth of a participant in the competency – Strategic Perspective
186% growth of a participant in the competency – Achievement Orientation
182 % growth of a participant in the competency – Building Leaders
163 % growth of a participant in the competency – Effective Communication
Outstanding Achievements:
The highest record of the overall average growth of 142 % was achieved in the competency – Customer Orientation
Highest growth of 375 % was achieved by a participant in the competency – Customer Orientation
Highest growth of 375 % was achieved by a participant in the competency – Planning and Execution
Highest growth of 370 % was achieved by a participant in the competency – Commitment for Excellence
Highest growth of 350 % was achieved by a participant in the competency – Driving Change
Connect With Us
Competence Curve
At Competence Curve, we believe that performance is a science. It's our job to take the guesswork out of the equation, and use proven scientific techniques to inspire leaders.
2nd fl., Great Eastern Bldg., 70, Ryder House, Nehru Place,
New Delhi 110019, India
sanjay.salooja@competencecurve.com
+91 98112 04000
+91 98992 89284
+91 99530 55605